
Organic spectroscopy can be used to identify and investigate organic molecules.

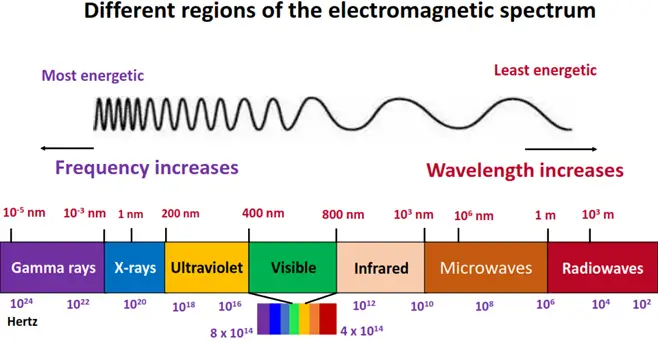
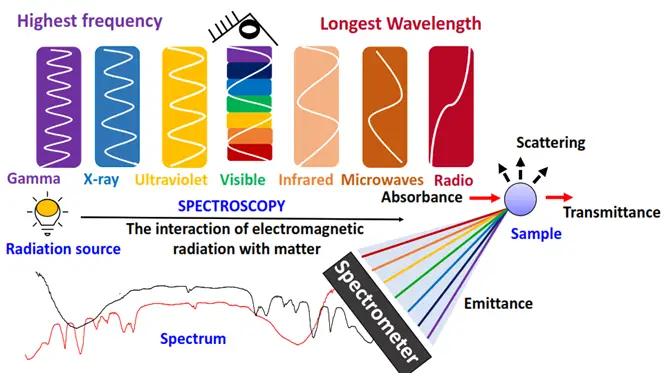
It deals with the interaction between electromagnetic radiation (EMR) and matter. These waves travel with the same velocity but differ characteristically in features such as frequency and wavelength.
In this article, we will discuss the three main types of organic spectroscopy, i.e.,
- Ultraviolet-visible (UV-Vis) spectroscopy
- Infrared (IR) spectroscopy
- Nuclear magnetic resonance (NMR) spectroscopy
A brief introduction, along with the principle and specificity of each technique, is provided. Moreover, their important uses and applications are also mentioned.
So let’s start reading to learn about all these important spectroscopic techniques.
Generally, in absorption spectroscopy, the manner in which energy is absorbed varies based on the frequency of UV-Vis, IR and NMR regions. But the basic absorption process of a definite amount of energy stays the same.
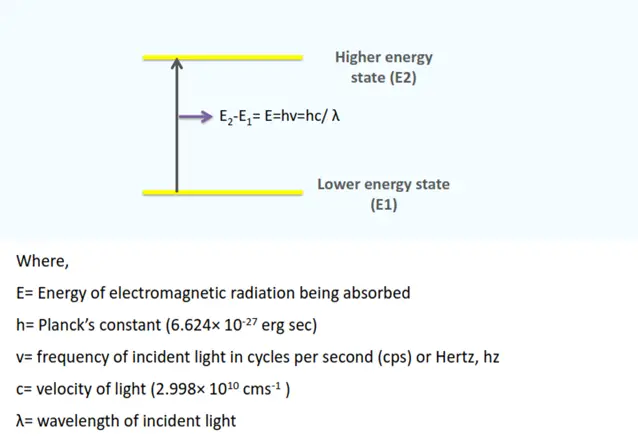
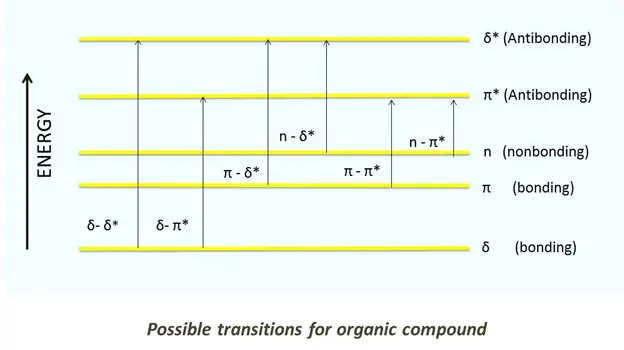
A definite amount of energy is needed to transition electrons from the ground state (E1) to the higher energy state (E2). This energy is equivalent to the energy of EMR that leads to transition.
Now let’s look at the three main types of organic spectroscopy one by one.
UV-Vis Spectroscopy
Ultraviolet-visible (UV-vis) spectroscopy is an analytical technique that deals with the interaction between ultraviolet-visible light and matter at the electronic level. UV spectrum ranges between 180 nm to 400 nm while the visible region extends from 400 nm to 800 nm of the electromagnetic radiation.
UV-Vis spectroscopy mainly gives information about,
- π-electron system
- aromatic compounds
- conjugated unsaturation
- conjugated non-bonding electron system etc.
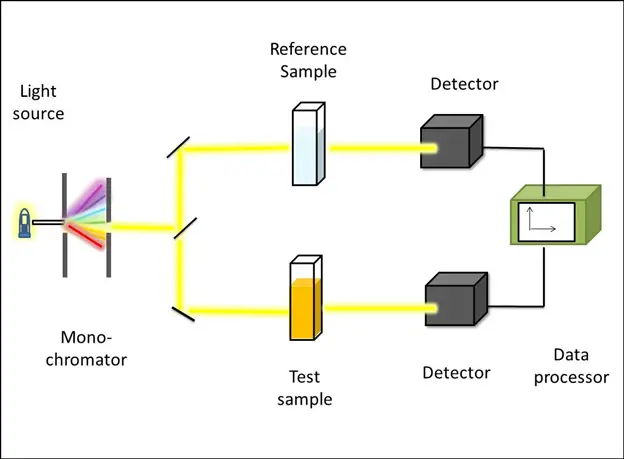
Working principle of UV-Vis spectroscopy
The absorption of ultraviolet/visible light by various chemical compounds forms the basis of UV-visible spectroscopy. When the matter absorbs a photon of light, it results in the excitation and de-excitation of electrons, which produces a distinct UV/Vis spectrum.
The information obtained from UV-Vis spectroscopy is presented as a plot of absorbance, transmittance or optical density against a function of wavelength. The graph is called an absorption spectrum, as absorbance is often selected on the x-axis.
Conjugation and color
The color that a compound exhibits mainly depends on the extent of conjugation. Conjugation simply refers to the alternate arrangement of pi bonds in an organic molecule.
For example, β-Carotene is a highly conjugated pi-bonded system that absorbs visible light near blue color. The color that appears to the human eye is the complementary color of the color that is absorbed by the sample. Therefore, fruits and vegetables rich in beta-carotene appear red-orange in color, such as carrots, apricot, and pumpkin. etc.
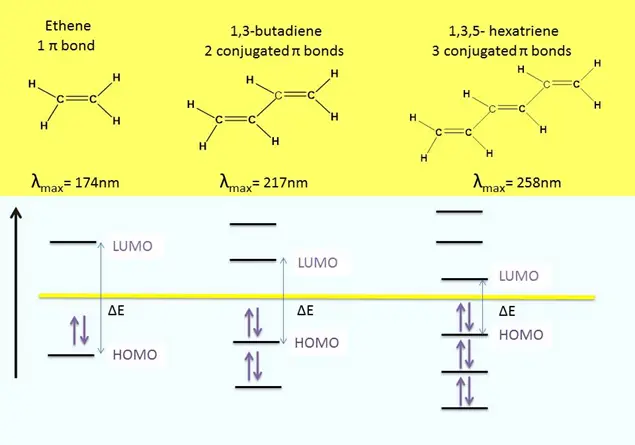
From the figure drawn above, you can clearly see that as the conjugation in a molecule increases, the HOMO-LUMO energy gap decreases. Meanwhile, λmax keeps on increasing, extending toward the visible region (where colors are visible). Conjugation and λmax are in direct relation; thus, λmax increases as the conjugation increases.
Specificity of UV-vis spectroscopy
- Non-Destructive: UV/Vis spectroscopy is marked a non-destructive organic spectroscopic technique as it allows reusing the sample for further analyses.
- Easy Instrument Handling: Little user training is required prior to use, as the UV/Vis instrument is quite convenient to handle.
- Minimal processing: For data analysis, minimal processing is required in UV/Vis spectroscopy.
Uses and applications of UV-Vis spectroscopy
UV/Vis spectroscopy is used:
- To analyze the optical behavior of an analyte in the sample.
- For the identification of organic molecules.
- For quantification of target analytes, etc.
UV-Vis spectroscopy is quite valuable for organic chemists. Some of its applications are as given below:
1.Detection of functional groups and conjugation
- UV-Vis spectroscopy is a tool to detect the functional groups and conjugation present in a sample.
- Appearance of a band in the ultraviolet region (200-400 nm) shows the presence of a characteristic functional group such as:
- Carbonyl (C=O) group
- Carboxyl (COOH) group
- Aromatic rings
- Absorption by the sample below this region indicates the absence of these groups.
- In addition to detection, this technique also helps determine the extent of conjugation present in a sample.
2. Identification of an organic compound
- Unknown compounds in the sample can be identified via UV-vis spectroscopy.
- The spectrum of the unknown sample is compared with the standards available in the literature.
3. Compound configuration
- UV-Vis spectroscopy can differentiate between cis and trans isomers of organic compounds.
- Generally, due to a symmetrical arrangement, trans isomers give absorption at shorter wavelengths than their cis counterpart.
Exception: Stilbene has a reverse case where the trans isomer is observed at a longer wavelength due to coplanar structure and resonance.
4. Other applications
- Differentiation between the axial and equatorial position of atoms in a compound.
- UV/Vis spectroscopy can also help distinguish between similar structures such as vitamin A1 and A2.
More extensive information on UV-Vis spectroscopy is provided in our special article.
Infrared spectroscopy
What is infrared spectroscopy? – Its basic working principle
Infrared (IR) spectroscopy is a spectroscopic technique that exploits the infrared region of the electromagnetic spectrum. IR region exists between the visible and the microwave region. Organic or inorganic compounds having covalent bonds interact with electromagnetic radiation in the infrared region.
IR spectroscopy is valued for its remarkable accuracy and sensitivity. This is why it is an important analytical tool for both qualitative and quantitative analysis of organic compounds.
In infrared spectroscopy, the analyte absorbs a specific part of the incident light in the sample while the rest is transmitted.
The IR spectrum contains two main regions:
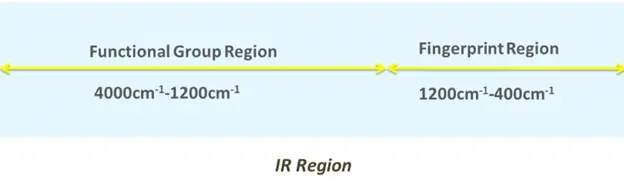
Functional group region:
- Majority of functional groups give absorption bands between 4000-1200 cm-1.
- Peaks in functional group regions represent different functional groups. By interpreting those peaks, functional groups can be determined in a molecule (organic or inorganic).
Fingerprint region:
- This region ranges from 1500-400 cm-1.
- Bonds connect atoms in a molecule, and each bond acquires an exclusive position at the IR region represented by its characteristic peaks.
- These characteristic peaks are observed in the fingerprint region of the molecule.
Which molecules are IR active? – Selection criteria
During vibrational and rotational motions, those molecules that can observe a net change in their dipole moment are generally IR active.
A diatomic molecule containing identical atoms is IR inactive as no net dipole moment exists.
IR spectroscopy exploits the frequencies of bond vibration within a molecule.
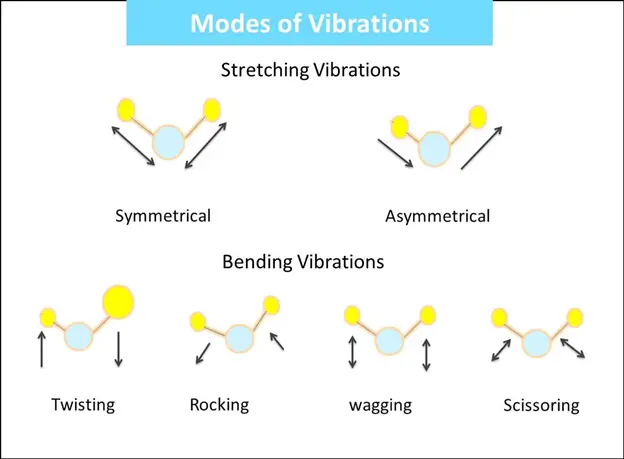
Thus, IR spectroscopy mainly depends on the atoms’ vibration and the chemical compound’s net dipole moment.
As infrared radiations (4000-1200 cm-1) interact with the sample, vibrating atoms absorb this incident light of a particular energy. The energy of vibrating bonds must equal the absorption energy to produce an infrared spectrum.
Specificity of IR
- Rapid analysis
IR spectroscopy helps in performing analysis very quickly. Several samples can be tested in rapid succession resulting in high throughput.
- Wide range of sample types
This technique is versatile as it facilitates the analysis of a huge range of sample types.
Uses and applications of IR spectroscopy
- The main use of IR spectroscopy is in the identification and determination of components of many organic and inorganic compounds.
- The major purpose of IR is the identification of diverse functional groups present in these samples.
- For quantitative estimation, the absorption and transmitted intensity of the analyte are measured.
IR spectroscopy has immense use in research and industry as well. A few of the prominent applications of IR are as mentioned below.
1.Identification of an unknown component
- The main use of IR spectroscopy is to identify unknown samples.
- Without prior knowledge, unknown and complex materials can be identified with spectral reference libraries and modern search algorithms.
2. Research and Laboratory use
- IR spectroscopy helps analyze various samples in research and laboratory use.
- The samples may include inorganic compounds, organic molecules, to even extensive structures such as metal organic frameworks (MOFs).
- Examination of reactants, intermediates, or products can be done at any stage of the reaction via IR spectroscopy.
3. Analyte quantification
- IR spectroscopy quantifies the components of the sample with great precision in a single measurement.
- It is performed via the calibration of IR data by applying the reference method.
4. Medical Field
- Composition of body tissue and fluids can be analyzed through IR.
- For example, every person has a characteristic blood IR spectrum that may give valuable insight into the person’s health.
An advanced version of infrared spectroscopy is FTIR spectroscopy; here is a detailed account of that.
NMR Spectroscopy
What is NMR spectroscopy? – Its basic working principle
Nuclear magnetic resonance (NMR) is a type of organic spectroscopy in which the nucleus of an atom absorbs electromagnetic radiation in the radiofrequency region (4-900 MHz).
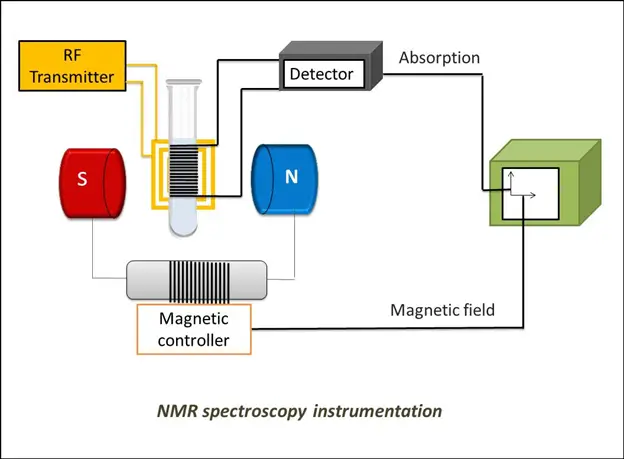
It can detect energy absorbed due to changes in an atom’s nuclear spin state. It observes the nuclear spin interaction of the sample with a magnetic field for analyzing molecular structure.
NMR active and inactive elements
- Elements with an odd atomic number or atomic mass possess a nuclear spin and thus show NMR spectra.
- Elements with an even atomic or mass number have zero spin value and produce no NMR spectra.
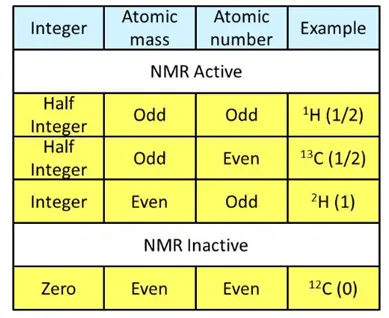
NMR active atomic nuclei such as 1H and 13C have spin and electric charges. When subjected to an external electrical field, energy transfer from the ground to a higher energy state is possible. However, this energy transfer takes place only if the energy provided by the radio frequency is exactly equal to the energy gap between the two transition states.
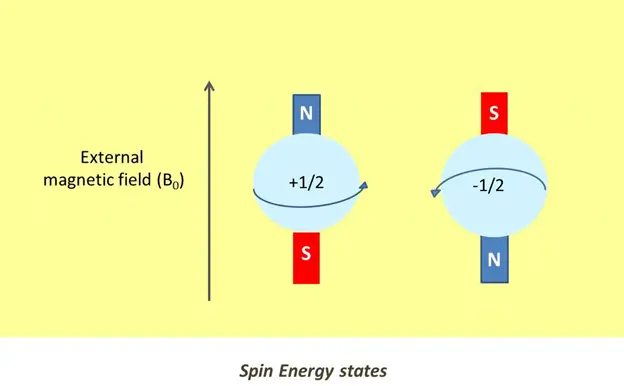
In the absence of a magnetic field, nuclear spins are randomly arranged. They get aligned in either the same or opposite direction to the magnetic field when exposed to an external magnetic field (Bo). This is important because symmetry and distribution of magnetic dipoles facilitate in determining the internal structure of a molecule.
Specificity of NMR
- In NMR, every specific nuclide absorbs at a specific frequency so that this technique can discriminate between various elements and isotopes.
- This specificity indicates that NMR can usually detect a single isotope at a time, leading to different types of NMR spectra.
- For example: 1H NMR, 13C NMR and 31P NMR, to mention a few.
Uses and Applications of NMR spectroscopy in Organic Chemistry
1.Identification of the unknown compound
- NMR spectroscopy is often combined with infrared spectroscopy to determine the structure of unknown compounds.
- It is specific in providing details about a molecule’s atomic structural arrangement and bond connectivity.
2. Proton count in a molecule
- NMR spectroscopy gives information about the number of proton or hydrogen atoms within organic molecules.
- The chemical environment near the resonating proton can be studied via NMR spectroscopy.
3. Detection of hydrogen bonding in a compound
- NMR can identify and characterize the hydrogen bond interactions present in a molecule. For example, hydrogen bonds in a DNA-protein complex.
- With the coupling constant values given for geometrical isomers, NMR spectroscopy can distinguish between them.
You may also like our article; What are those 10 different spectroscopic techniques.
References
1. Akash, M. S. H. & Rehman, K. 2020. Ultraviolet-visible (UV-Vis) spectroscopy. Essentials of pharmaceutical analysis. Singapore: Springer Nature Singapore.
2. Capuano, E. & Van Ruth, S. M. 2016. Infrared spectroscopy: Applications. In: Caballero, B., Finglas, P. M. & Toldrá, F. (Eds.) Encyclopedia of food and health. Oxford: Academic Press.
3. M.Younas 2017. Organic spectroscopy and chromatography.
4. Singh, M. K. & Singh, A. 2022. Chapter 14 – Nuclear magnetic resonance spectroscopy. In: Singh, A. K. & Singh, A. (Eds.) Characterization of polymers and fibers. Woodhead publishing.
