
In economics, MPC or marginal propensity to consume is a powerful tool as it indicates consumers’ behavior with respect to any changes in their income. But many find it hard to learn how to calculate MPC as there are not many resources available online covering this topic. Even the ones that are available only explain the steps to calculate MPC. But this might not be enough for everyone.
Marginal propensity to consume is the core of Keynesian economics. It is a metric that measures what proportion of income are people spending on the consumption of services and goods than saving the money when consumers experience any changes in their income level. Learning this can help identify the necessary lifestyle changes you need to make when you receive an increase in income.
This article will show you the MPC (Marginal Propensity to Consume) formula, and provide you with a step-by-step guide on how to calculate it with some practical examples that will teach you how it can be applied in different scenarios. The article will also explain what different MPC values mean and the importance and application of this tool in the real world.
MPC (Marginal Propensity to Consume) Formula
The MPC (Marginal Propensity to Consume) is calculated by dividing the change in consumption (ΔC) or spending by the change in disposable income (ΔI).
The MPC (Marginal Propensity to Consume) formula is expressed as,
MPC = (Change in Consumption) ÷ (Change in Income)
Or
MPC = ΔC ÷ ΔI
The Marginal Propensity to Consume formula can be further elaborated into the following format,
MPC = (C1 – Co) ÷ (I1 – Io)
Where,
- Co = Initial consumer consumption
- Io = Initial disposable income
- C1 = Final consumer consumption
- I1 = Final disposable income
Calculation Step by Step
To calculate MPC (Marginal Propensity to Consume), follow the steps given below:
Step 1: First, note down the initial consumer consumption (Co) and initial disposable spending (Io). Then identify the final consumer consumption and final disposable income which are denoted by C1 and I1 respectively.
Step 2: Deduct the initial consumer consumption (Co) from the final consumer consumption (C1). This will give you the change in consumption (ΔC) quantity which is the numerator of the MPC formula.
Change in consumption, ΔC = C1 – Co
Step 3: Now find out the denominator of the MPC formula i.e the change in income (ΔI) by subtracting the initial disposable income (Io) from the final disposable income (I1).
Change in income, ΔI = I1 – Io
Step 4: Finally, divide the quantity from step 2 by the quantity from step 3 to calculate MPC.
Practical Examples
Take a look at the following examples to get a clear idea of how to calculate MPC using the formula mentioned above:
Example 1 – MPC (Marginal Propensity to Consume) Formula
Let’s take a look at this hypothetical example here. Consider, you work in an IT company. Due to your excellent performance in completing a difficult project, your boss rewarded you with a $400 bonus paycheck. After receiving the bonus, you went out to a nice dinner to celebrate where you spent $100. Determine the MPC in this example.
After receiving the bonus, you have $400 more in income than you had last month. And you spent some money celebrating your success.
So, in this example,
Change in income, ΔI = $400
Change in consumption, ΔC = $100
The following table shows the data required for calculating the MPC in this example.

Now, to calculate the MPC, use the following formula in cell C4:
= C3/C2
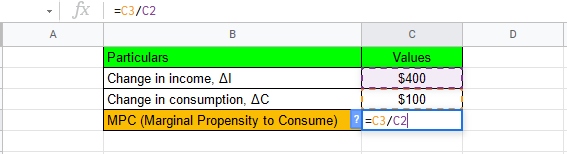
This will give you the calculated MPC for this particular example.

Here, in this example, the marginal propensity to consume is 0.25.
Example 2 – MPC (Marginal Propensity to Consume) Formula
For this example, let’s assume Alex is a soft drink lover. Usually, he drinks 20 liters of soft drink every month. But in the current month, he received a bonus from his boss for his excellent performance in a difficult project. As a result, his monthly payout went up from $200 to $400. With this increase, his monthly soft drink intake also went up from 20 to 25 liters.
Consider, each liter of soft drink costs $4. Determine the MPC for Alex.
Here,
The initial consumer consumption, Co = 20 × $4 = $80,
The final consumer consumption, C1 = 25 × $4 = $100,
The initial disposable income, Io = $200 and
The final disposable income, I1 = $400
The table given below shows the data required for calculating the MPC in this example.
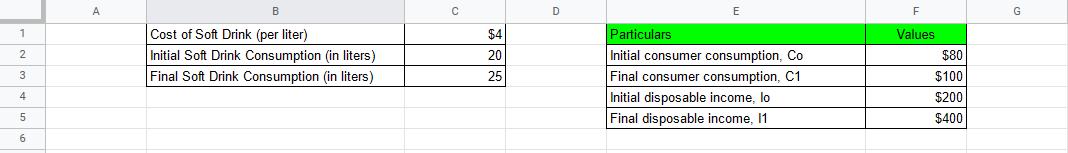
Now, use the following formula to calculate the change in income i.e. ΔI in cell C12:
= F5-F4

Copy the formula given below and put it in cell C13 to calculate the change in consumption i.e. ΔC:
=F3-F2

Now, calculate the MPC, use the following formula in cell C14:
= C13/C12


Here, the marginal propensity to consume for Alex is 0.1.
Types of MPC
Depending on the value of MPC, it can be divided into four categories. These are discussed below:
MPC Less Than 1
If the value of marginal propensity to consume is less than one, this means the change in income has led to a proportionately smaller change in the consumption of a particular good. Such correlations can sometimes be seen for goods or services associated with price elasticity of demand less than one.
These services and goods are thought to be essentials. The demand for such goods is less volatile compared to the demand for non-essential services and goods. And any increase in price for such goods will not experience little to no change in demand.
MPC Equal to 1
When the marginal propensity to consume is equal to one, this indicates changes in income level have resulted in exact proportionate changes in the consumption of a particular service or product.
This type of correlation can be seen for services and goods having price elasticity of demand equal to one. The demand for such goods tends to change linearly when the price changes. But this type of service and goods can rarely be found in the real world.
MPC Greater Than 1
If you observe that the MPC value is greater than one, it means that the changes in income have resulted in a proportionately larger change in consumption of a particular good or service. Such correlations can be seen in goods and services with price elasticity of demand greater than one.
The demand for such services and goods changes by a disproportionately large factor in the case of a price change. This type of goods is mostly regarded as non-essential or luxury goods.
MPC is Equal to 0
If you notice that the MPC value is equal to 0 that means any change in income level doesn’t change the consumption of a good.
You can observe such correlations only for goods with a price elasticity of demand of 0. This means, no matter how the price changes, the demand for that good or service will remain the same.
Use and Importance of MPC
Supporters of Keynes’s macroeconomics theory often argue that an increase in income level as a result of increased production will increase people’s consumption level. To put this argument in simple words, the more people are paid, the more they are likely to spend.
This process works in a cycle as this raise in consumption will eventually fuel production. And more production equals more income.
MPC is a very powerful tool for economists to track consumption based on household income. Experts use this tool to find out how varying income levels and wealth across countries impact the level of spending compared to the savings of many households.
Conclusion
Hopefully, through this article, I was able to clear all your confusion regarding how to calculate MPC (Marginal Propensity to Consume). Take your time to calculate your own MPC. It can help you identify your consumption habits. It is really very important to understand how much money you are spending unnecessarily!
