
Understanding the concept and methodology of calculating the average rate of change is fundamental. It is used to mathematically describe the difference in the value of a quantity in percentage for some other amount over a specified period. It represents the momentum of an item. The calculation of the average rate of change is straightforward. It simply takes the worth of a stock or index and divides it by its value from previous days.
In more specific words, the average rate of change can be defined as the average rate upon which one quantity (the price of goods, the number of goods, etc.) is changing following the shift in some other quantity. Also, an average rate of change is a method that evaluates the change of amount in one quantity or item divided by the corresponding change of amount in another object.
Some standard calculation of the Average Rate of Change that occurs in daily life are as follows:
- Distance per Liter: This can be calculated by dividing the length or the miles traveled by a vehicle by the number of liters of gas used.
- Kilometers per hour: This can be evaluated by dividing the number of kilometers traveled by the time in hours the vehicle took to cross them.
This article will elaborate on average rate of Change, average rate of Change formula, show its calculations step by step and its applications in practical situations.
Average Rate of Change Formula:
The average rate of change function is a process that evaluates the change in one variable quantity divided by the change in some other variable quantity. Using function notation, we can define the average rate of change of a function f from i to j.
Avg (x) = ( f(j) – f(i) ) / ( j – i )
Where:
Avg = average rate of change of a function
x = The change in the input of the given function
f(j)-f(i) = The change in input of the function from j to i.
What is the Average Rate of Change?
The average rate of change is the rate of speed upon which a variable quantity changes with respect to the variation in another quantity in a defined time. The Average Rate of Change is mainly used when talking about momentum. It may usually be expressed as a quantitative relation between a change occurring in one variable quantity to a corresponding change occurring in another variable. In graphical terms, the average rate of change is expressed by the slope of a line. The Greek letter delta often denotes the Average Rate of Change.
We can observe that the Average Rate of Change function is a lot like the formula for finding the slope of a line. When two distinct points are taken on a curve, (i1,j1) and (i2,j2), the slope of the line joining the points will be the average rate of change from i1 to i2. Hence, it is derived from the slope of a straight line joining the interval’s endpoints on the function graph.
Significance of Average Rate of Chance:
Calculating the average rate of change is a crucial financial concept because this permits the investors to identify security momentum and different trends. For instance, security with high momentum, or one that incorporates a positive Rate of Change, usually outperforms the market in the short term. Conversely, security that includes a rate of change that falls below its moving average or incorporates a low or negative rate of change will probably lessen the value. It may be seen as a sell signal to investors.
In addition to this, the average rate of change is a good indicator of market bubbles. Be that as it may, momentum is pretty good, and traders search for securities with a positive rate of change. If a broad-market ETF, index, or investment trust contains a sharp increase in its rate of change within the short term, it should indicate that the market is unsustainable. If the average rate of change of associate index or alternative broad-market security is over five hundredths, investors tend to be cautious of a bubble.
How to Calculate the Average Rate of Change:
Calculation of the average rate of change is a significant step because most traders pay very close attention to the rate upon which the worth of an item changes relative to the other object. For instance, options traders study the connection between the speed of change in the value of an option to change in the value of the underlying asset, called an options delta.
Calculation Step by Step:
- Collect all the required past data, for example, the prices of gas over the past few years.
- Choose the interval over which you need to find the average rate of change.
- Apply the formula and substitute the initial and final values of the interval.
Avg (x) = ( f(j) – f(i) ) / ( j – i )
Example 1:
Find the average rate of change in gas price between 2007 and 2009 from the given data.
| t | 2 | 3 | 4 | 5 | 6 | 7 | 8 | 9 |
| C (t) | 1.47 | 1.69 | 1.94 | 2.30 | 2.51 | 2.64 | 3.01 | 2.14 |
The given data shows that the cost of gas was $2.64 in 2007. In the year 2009, the price was $2.14. We have our initial and final values now. We have to substitute them in the formula:
Avg (x) = (f (j) – f (i)) / (j – i)
Where:
Table 1: Required Data of problem
| Function | Value |
| f(j) | 2.14 |
| f(i) | 2.64 |
| j | 2009 |
| i | 2007 |
Substituting the values:
Avg (x) = (2.14 – 2.64) / (2009 – 2007)
= $ -0.25 per year
The negative sign indicates a decrease in the price of gasoline over the years.
Example 2:
Consider you are planning to go on a road trip with your friend. After picking up your friend from his house, which is 10 kilometers away from your house, you decide to note and observe your distance from home over time. Find the average speed for 6 hours from the given data.
| t (hours) | 0 | 1 | 2 | 3 | 4 | 5 | 6 | 7 |
| D(t) (kilometers) | 10 | 55 | 90 | 153 | 214 | 240 | 292 | 300 |
You traveled 282 kilometers in 6 hours. For an average speed, we need to calculate the average rate of change of speed.
Avg (x) = (292 – 10) / (6 – 0) = 47 kilometers per hour
Calculating Average Rate of Change in Excel:
To calculate the Average Rate of Change, let us take an example of a bicycle.
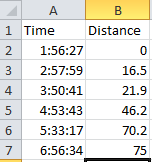
To calculate the average speed of the bicycle (the average rate of change) in Excel, you can easily do as follows:
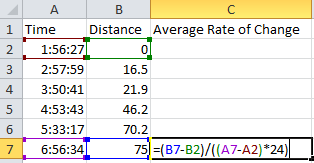
Select the blank cell next to the cell with the last distance. For instance, in our sheet, select cell C7 and enter the following formula.
=(B7-B2)/(A7-A2)*24

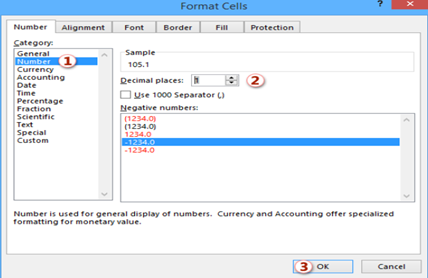
Now open the pop-up menu of the answer cell, and from the list, click on format cells.

In the “Format Cells” menu box, select the Number tab and then:
- Click on Number.
- In the Decimal section tab, choose the number of decimals you want to get for an average rate of change
- Select OK
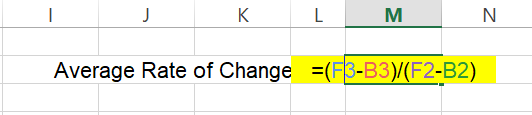
In this way, you can compute the average rate of change in excel.
Average rate of Change from graphs
Determining the average rate of Change from the graph is as same as finding the slope between any two given points. Let’s take some practical problems and find the average rate of change with graphical interpretation.
Example 3
A flying Jet covers its destination in 6hr. The pilot also records distance f (t) =3t2+8t+1 over time. Calculate average rate of change for the Jet for the first 4 hours?


Example 2
Given the function f (t), Compute the average rate of change on the interval [-2, 4] by using the graph shown below.
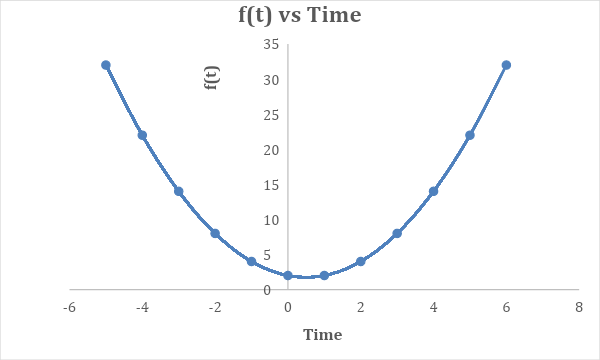
The Graph shows that function f (t), at f (t =-2) = 8 and at f (t = 4) = 14.


FAQs:
| Sr. | Questions | Answers |
| 1 | What is the difference between the Instantaneous Rate of Change and average rate of change | The instantaneous rate of change is used at a single point while the average rate of change is used over a range. |
| 2 | What is the difference between the average and average rate of change? | Average rate of change is the change of a variable to another variable, while the average is the total sum divided by the count. |
| 3 | What’s the Difference between Finding the Slope of a Line and an Average Rate of Change? | When finding the slope of a line, we are primarily interested in its visual steepness, while when calculating the average rate of change, we are interested in finding the change occurring in the output due to change in input. |
| 4 | What do you need to know to compute the Average Rate of Change? | we can compute the average rate of change in all following situations: |
| Given | Approach |
| Two points, i(x1,y1) & j(x2,y2) | y2 – y1 / x2 – x1 |
| A function ƒ and an interval [i,j] | f(j)–f(i) / j–i |
| Change in inputs and change in outputs | Delta y / Delta x |
