Imagine you own a farm and you want to optimize the amount of water that your horses drink. Some of them drink more and some less water depending on their size, so it is reasonable to make some amount available that meets each horse’s needs and, at the same time, not waste any water.
This type of challenge requires you to measure not only the amount of water each of your horses drinks, but also to determine how much that quantity can vary within the group of horses.
One way to determine how much a variable such as “water consumption” varies within a group is to determine its dispersion, meaning how big is the difference between the lowest and the largest amount of water being consumed. This is precisely what that variable’s range can tell us. Let’s discover this simple and interesting characteristic!
How to calculate range
The range of a data set is calculated by subtracting the lowest value from the highest value in it.
What is range
When you measure the same characteristic in each sample of a group of objects or individuals, like their size, weight, volume, etc., the group of answers you end up with is called a data set. This collection of data points can describe the group you measured and provide valuable information about it.
Not all data sets are the same. Some have data points that can take any value, and some only data points that take specific values. For example, if you are measuring how tall every person is in a group of people, your data set could look something like this:
| Person | Height |
| Andrew | 1,75 m |
| Lily | 1,60 m |
| Sandra | 1,83 m |
| Johny | 1,67 m |
| Francois | 1,92 m |
| Maria | 1,76 m |
On the other hand, if you are measuring people’s eye color, you might end up with a data set like this:
| Person | Eye color |
| Andrew | Brown |
| Lily | Hazel |
| Sandra | Blue |
| Johny | Green |
| Francois | Blue |
| Maria | Hazel |
In the second case, the data points only take a few possible values (brown, hazel, blue, and green) while in the first case the results can be any possible number —greater than zero, of course.
Eye color is a type of nominal variable, which means it can take any value within a preset group of values which have no specific order or rank. Another example of this type of variable is the city you were born in, your nationality, your favorite food, etc.
On the other hand, height is a type of continuous variable, which means it can take any value within a certain range. This type of data has the characteristic that, when measured, it can be analyzed directly by using statistical methods without the need of preprocessing it.
The type of statistical analysis you use with a data set should depend on the type of variable that was measured. For example, in our eye color-measurement it does not make any sense to try to determine the “average eye color”. On the contrary, when measuring people’s height, it makes perfect sense to determine the average height within the group.
Continuous variables are subject to many different “statistical measurements” —also called sample statistics— you have probably heard of, like the average, the standard deviation, the variance, etc.
When analyzing a data set, an interesting characteristic is how dispersed are the data points in it. By dispersed we refer to how spread the obtained values are in our measurement, or how large their variation can be.
For example, if we measure people’s height, we might want to know how different this variable is within the group we are studying. If the group is only composed of individuals from the same region of the world, height won’t probably vary that much, meaning most of them will have similar heights. On the other hand, if we have a group made up of people from all over the world, we will probably end up with very different values each time we measure their height.
The difference between these both scenarios can be quantified by measuring the variable’s dispersion. One very simple way to do this is by determining its range.
The range of a data set refers to the distance between the highest and the lowest values within it. This interval contains all the values that were obtained in our measurement, and the greater it is, the more spread our data points are. Range is therefore calculated as:

Where xmax and xmin refer to the maximum and minimum values within the data set, respectively. Since the range is calculated by performing a subtraction, it has the same units as the variables in the data set.
The range of a data set is a limited measure of dispersion. This means, since it is calculated by taking only two data points from the entire group into account, it provides a more inaccurate measurement as the number of points in the data set grows.
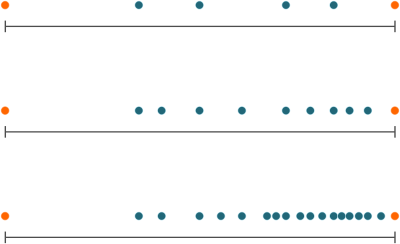
The following image clarifies this. The more data points we have, the more clear it is that the data set’s range is not an accurate description of their dispersion in this case, since the lowest point is really far away from the others. This can imply, for example, that data point is an outlier or is the result of a measurement error.
How to calculate the range of a data set
- Review each data point in your data set and find the highest and the lowest values.
- Determine the range by subtracting the lowest value from the highest value.
Example 1: consider the following data set and calculate its range.
| Horse | Water consumption per week |
| Lucky | 100 l |
| Hendrick | 112 l |
| Lollipop | 90 l |
| Albert | 105 l |
| Rose | 102 l |
| Iggy | 98 l |
Each horse’s water consumption is shown. The highest value is 112 l (Hendrick) and the lowest one is 90 l (Lollipop). The range is therefore:

How to calculate the range of a large set of data
When you have thousands of data points it is impractical to manually review them to determine the highest and the lowest values. Nevertheless, Excel, Google Sheets or similar spreadsheets are very useful in these cases. In this section we will show you how to build an automatic range calculator with Excel, step by step.
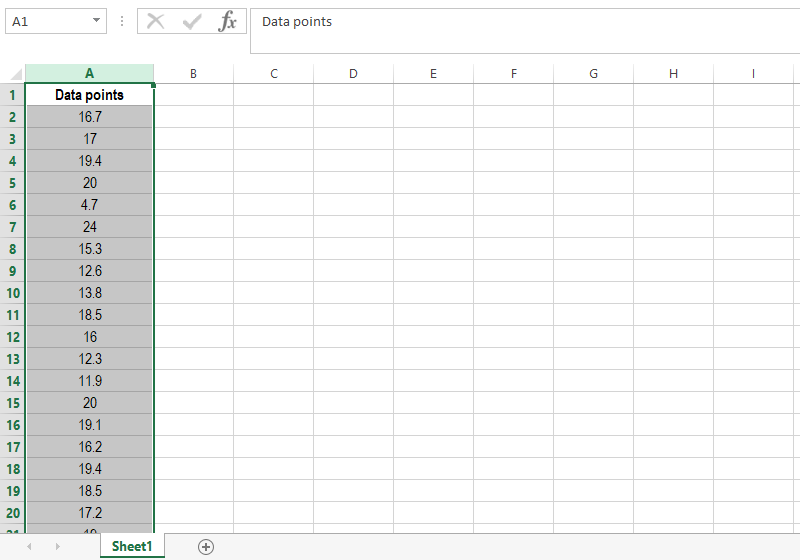
STEP 1
Create a new spreadsheet and label the first column as “Data points”. Paste your data on that column making sure the numbers are formatted as such. To do this, check whether your Excel version uses commas or dots as decimal separators.
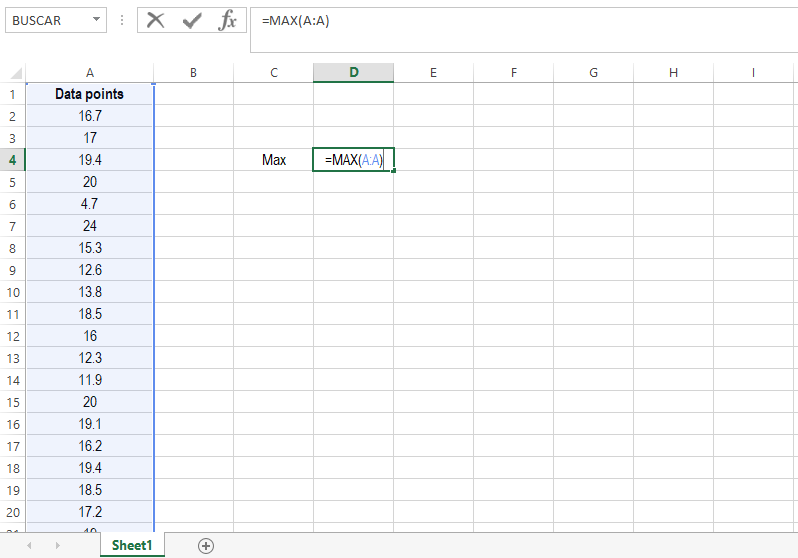
STEP 2
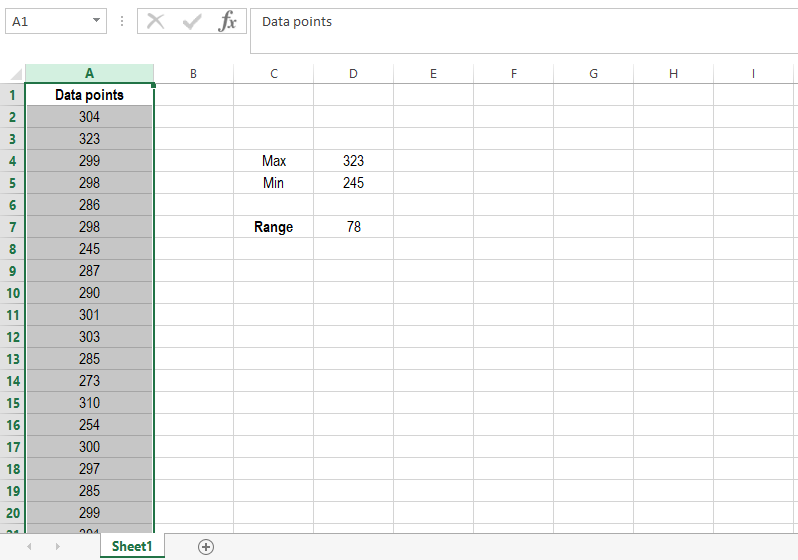
Label any cell near your column as “Max”. You will extract the highest value of your data set here. Write the following equation next to it: =MAX(A:A). This equation does the hard work: it finds the maximum value in your data set. Don’t worry if this value is repeated within your data, this formula works as well.
STEP 3
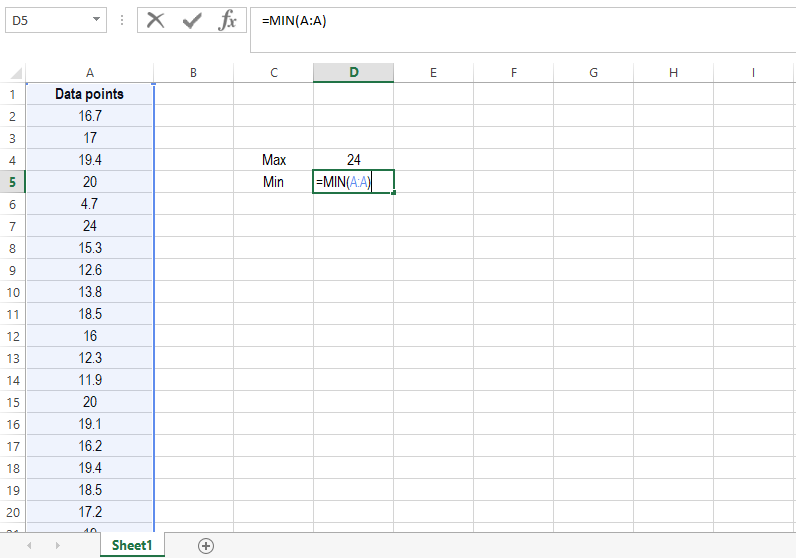
Label the cell below “Max” as “Min”. To find the lowest value within your data cell, write the following equation: =MIN(A:A). This formula works similarly to the previous one, and it will save you a lot of time!
STEP 4
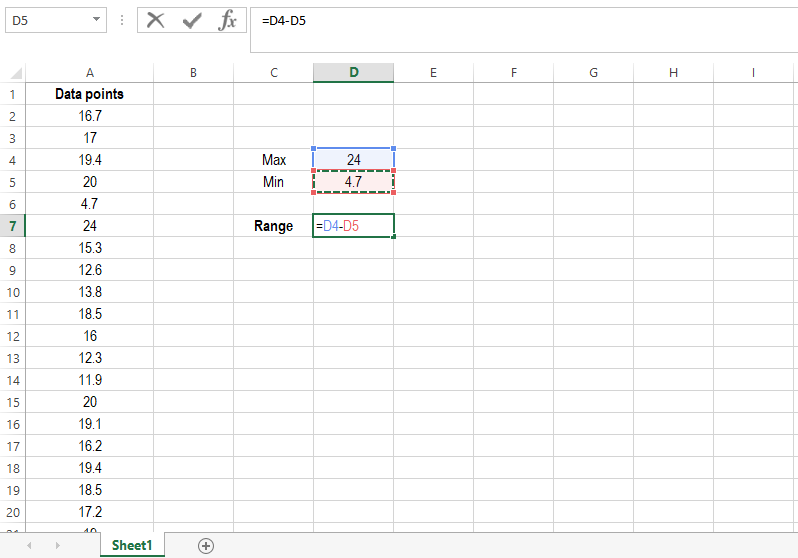
Now that you have found the maximum and minimum of your data set, you can proceed to calculate its range. To do so, simply subtract the latter from the former in any cell, as the image shows:
Now that you have developed an automated sheet, you can calculate the range of any data set in a few seconds, just by pasting a list of all the values into the first column.